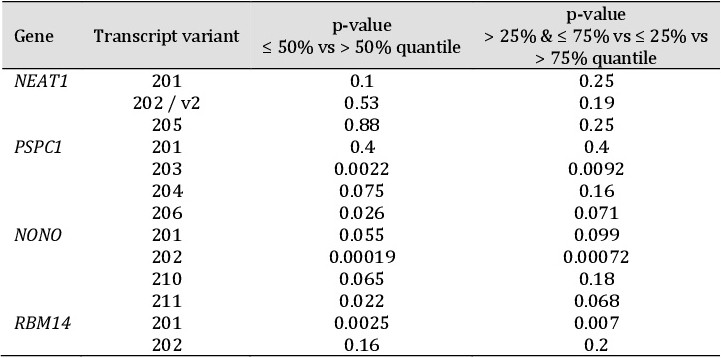
Table 1. Kaplan Meier survival analysis according to the expression level of the respective transcript. Column 3: Patients were stratified into two groups, i.e. expression was above or below the median expression (≤ 50% vs > 50% quantile). Column 4: Patients were stratified into three groups, i.e. expression was low (below 25% expression quantile), high (above 75% expression quantile), or intermediate (>25% and <75% expression quantile). p-values ≤ 0.05 were considered as significant and are printed in bold letters. (TPM + 0.001) > 0. p-values ≤ 0.05 were considered as significant and are printed in bold letters